

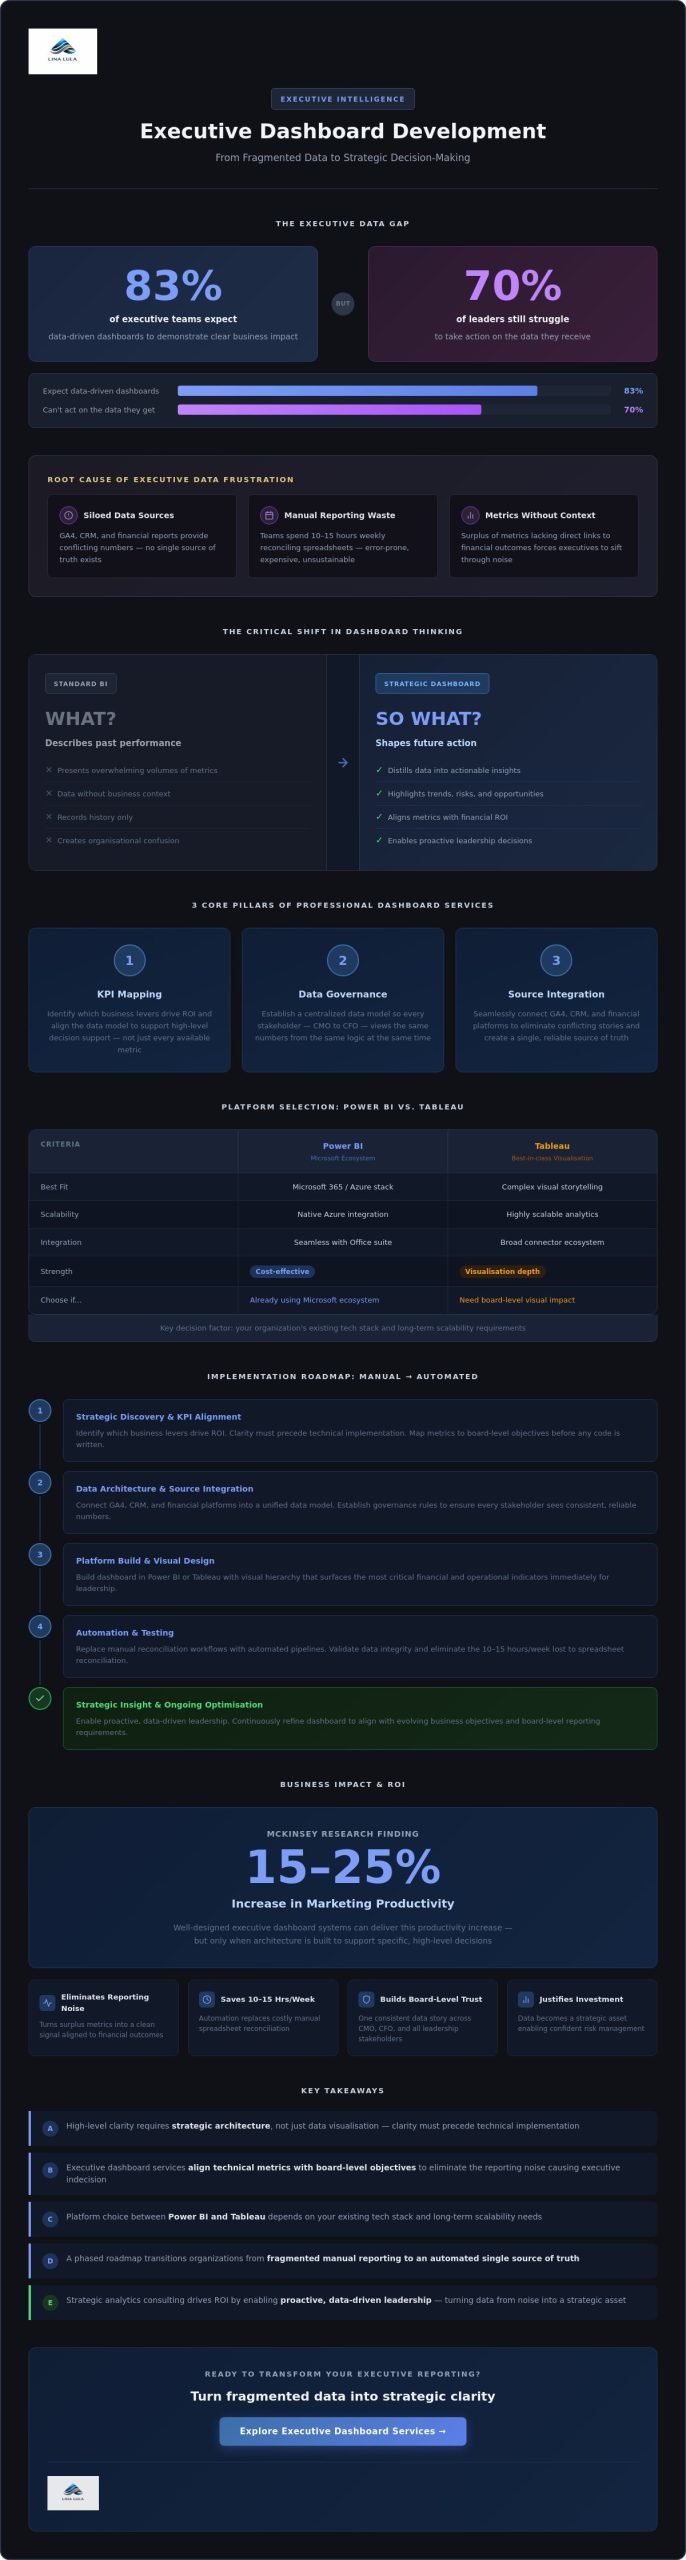
While 83% of executive teams now expect data-driven dashboards to demonstrate clear business impact, 70% of leaders still report difficulty taking action on the data they receive. You’ve likely experienced the frustration of a board meeting where GA4, CRM, and financial reports provide conflicting numbers. It’s a common scenario where your team spends hours on manual reporting only to produce visualizations that look impressive but lack the business context required for high-stakes decisions. This gap between raw data and strategic insight often leads to organizational confusion rather than clarity.
Professional executive dashboard development services solve this by transforming fragmented data sources into a single, reliable source of truth. We’ll show you how to move from manual, error-prone processes to automated systems that align technical metrics with financial ROI. By the end of this article, you’ll understand how a well-designed reporting framework can increase marketing productivity by up to 25%, turning your data from a source of noise into a strategic asset for board-level decision-making. We’ll examine the specific steps to bridge the divide between technical outputs and the pragmatic business outcomes your leadership demands.
Key Takeaways
- Understand why high-level clarity requires a foundation of strategic architecture rather than simple data visualization.
- Discover how executive dashboard development services align technical metrics with board-level objectives to eliminate reporting noise.
- Evaluate whether Power BI or Tableau best fits your organization’s existing tech stack and long-term scalability needs.
- Learn the phased roadmap for transitioning from fragmented, manual reporting to a reliable, automated single source of truth.
- Identify the specific ways strategic analytics consulting drives organizational ROI by enabling proactive, data-driven leadership.
Beyond Visualisation: Why Executive Clarity Requires Strategic Architecture
Standard business intelligence often focuses on the “what,” presenting a collection of metrics that describe past performance. Strategic executive dashboards focus on the “so what,” translating technical data into a roadmap for future action. This transition from simple visualisation to strategic architecture marks the difference between a tool that merely records history and one that shapes it. For leadership, the goal isn’t more data; it’s the elimination of reporting noise that hinders organisational agility. In 2026, this noise manifests as a surplus of metrics that lack a direct link to financial outcomes, forcing executives to sift through clutter to find a clear signal.
The shift from fragmented complexity to streamlined efficiency requires a unified data architecture. When your GA4, CRM, and finance systems exist in silos, you don’t have a strategy; you have a collection of conflicting stories. Professional executive dashboard development services solve this by establishing a centralized data model. This framework ensures that every stakeholder, from the CMO to the CFO, views the same numbers, derived from the same logic, at the same time. This alignment transforms data from a technical byproduct into a strategic asset that justifies investment and informs risk management.
The High Cost of Fragmented Data
Conflicting data sources do more than just cause confusion during board meetings; they lead to executive indecision and lost revenue. When 70% of business executives report difficulty in taking action on their data, the bottleneck is rarely a lack of information. It’s usually a lack of trust. If the CRM shows one growth figure and the finance report shows another, the resulting friction stalls momentum. This institutional paralysis is compounded by the hidden labor costs of manual reporting. Teams often spend 10 to 15 hours every week manually reconciling spreadsheets, a process that is not only expensive but prone to the human errors that undermine data integrity.
Defining the Strategic Dashboard
An executive dashboard is a decision-support framework that aligns real-time operational metrics with long-term financial objectives. It’s the intellectual engine that enables a leader’s success by providing a clear view of institutional health. Effective executive dashboard development services prioritize this definition before a single line of code is written. Clarity must precede technical implementation. This means identifying which specific business levers drive ROI and ensuring the data model supports those insights. McKinsey research indicates that well-designed systems can increase marketing productivity by 15-25%, but these gains are only possible when the architecture is built to support specific, high-level decision support rather than just displaying every available metric.
Key Components of Professional Executive Dashboard Development Services
Effective dashboard development is a strategic consulting process that begins long before a single chart is rendered. While standard reporting often presents an overwhelming volume of technical data, professional executive dashboard development services focus on the distillation of that data into actionable insights. This requires a rigorous architectural approach that prioritizes three core pillars: precise KPI mapping, robust data governance, and seamless integration of disparate sources like GA4, CRM, and financial platforms. By establishing these foundations, organizations move from a state of informational overload to one of structured clarity.
Designing for the executive mindset requires a shift from operational detail to strategic overview. Leaders don’t need to see every technical fluctuation; they need strategic data visualizations that highlight trends, risks, and opportunities. This involves creating a visual hierarchy where the most critical financial and operational indicators are immediately apparent. When complexity is replaced by precision, the dashboard becomes an intellectual engine for the board, providing the necessary context to justify major investments or pivot strategies with confidence.
KPI Mapping for Board-Level Reporting
The transition from fragmented metrics to strategic alignment starts with filtering out “vanity metrics.” Indicators like social media likes or raw website sessions often provide a false sense of progress without reflecting institutional health. Strategic KPI mapping focuses instead on metrics that directors actually care about, such as Customer Acquisition Cost (CAC) efficiency, Lifetime Value (LTV) ratios, and marketing attribution’s direct impact on bottom-line growth. By connecting technical outputs to board-level objectives, these services ensure that every department remains focused on the organization’s primary financial goals.
Technical Reliability and Automated Workflows
A dashboard is only as valuable as the data feeding it. Manual reporting is a significant liability, often consuming hours of team time and introducing human errors that undermine executive trust. Professional executive dashboard development services implement reporting automation to eliminate these risks. This process involves:
- Precise GA4 and GTM implementation to ensure digital marketing data is captured accurately at the source.
- Consolidation of CRM and finance data into a single source of truth for consistent cross-departmental reporting.
- Deployment of 2026-standard data security protocols, including permission-based access to protect sensitive financial information.
Establishing these automated workflows ensures that your leadership team always operates from a position of reliability. If your current reporting feels disconnected from your business objectives, reviewing an analytics readiness checklist can help identify the gaps in your existing data architecture. This methodical approach ensures that your technical infrastructure is fully aligned with your strategic vision, turning raw data into a reliable foundation for every major decision.
Power BI vs. Tableau: Selecting the Right Platform for Leadership
Selecting a business intelligence platform is a strategic decision that dictates the long-term scalability of your data operations. It’s not merely a choice between software vendors. It’s an assessment of which technical environment will best support your executive-level objectives. Professional executive dashboard development services prioritize this alignment, ensuring the chosen tool integrates with your existing tech stack rather than creating a new silo of complexity.
As of July 2026, Power BI holds a 36% market share, largely due to its dominance in Microsoft-centric organizations. Tableau maintains an 18% share, favored by teams requiring advanced visualization and multi-cloud flexibility. The right choice depends on your specific data architecture and the level of analytical depth your board requires. A consultant’s role is to ensure the technology serves the strategy, not the other way around.
Power BI for Integrated Ecosystems
For organizations already invested in Microsoft 365 and Azure, Power BI is often the most logical path. It offers seamless integration with the tools your team uses daily, reducing the friction of adoption. Its data modeling capabilities are robust, allowing for complex transformations within a familiar environment. From a cost perspective, Power BI Pro at $10 per user per month or Premium at $20 per user per month provides a predictable expenditure model for enterprise-wide deployment. This makes it an efficient choice for large-scale operations that require a unified reporting standard across multiple departments.
Tableau for Advanced Visual Storytelling
Tableau remains the industry standard for organizations that prioritize deep, exploratory data analysis and high-fidelity visual storytelling. It excels at handling massive, heterogeneous data sources with precision, making it ideal for multi-cloud environments. While Tableau Creator licenses cost $70 per user per month and Explorer licenses are $35, the investment is often justified by the platform’s superior ability to handle complex data relationships. Executives who require highly interactive, nuanced views of global operations often find Tableau’s intuitive interface more suited to spotting subtle market shifts.
The tool should never dictate the strategy. A seasoned strategist uses executive dashboard development services to evaluate your organizational readiness first. They ensure that whether you deploy Power BI version 2.155 or Tableau 2026.2, the output remains focused on institutional health and financial impact. This methodical selection process prevents the common pitfall of investing in a platform that your leadership team finds too cumbersome to use for daily decision-making.
The Roadmap to Implementing Automated Executive Reporting
Implementing a strategic reporting framework is a methodical journey that moves from fragmented complexity to streamlined efficiency. It’s not a one-off technical task but a structured consulting process designed to align your data with your vision. Without a clear roadmap, organizations risk building dashboards that display impressive visuals but fail to drive business outcomes. Professional executive dashboard development services follow a rigorous four-phase approach to ensure your data becomes a reliable intellectual engine for leadership.
This progression begins by identifying the gaps in your current infrastructure and ends with a fully optimized, automated system. Each phase is linked by the logic of cause and effect, ensuring that the final output is a natural consequence of a well-defined process. By following this roadmap, you eliminate the organizational confusion that stems from conflicting data sources and manual reporting errors.
The Analytics Readiness Assessment
Building a dashboard on a foundation of “dirty” data is a significant financial risk. The first phase of any successful implementation is an Analytics Readiness Assessment. This involves a deep dive into your current GTM and GA4 setups to verify measurement accuracy. If your data capture is flawed at the source, the resulting board-level reports will be compromised. We evaluate your existing tracking protocols to identify data gaps that could lead to executive indecision. This diagnostic step ensures that the architecture we build is rooted in precision rather than assumptions.
Consolidating Fragmented Data Sources
Once readiness is established, the focus shifts to creating a single source of truth. This phase involves technical strategies for merging digital marketing data with internal sales and CRM records. It’s here that we map marketing attribution directly to bottom-line business growth, providing the financial context that directors demand. Establishing this unified reporting workflow reduces organizational noise and ensures that every department is aligned around the same KPIs. The transition from reactive spreadsheet maintenance to proactive data-driven strategy is only possible when your data sources are consolidated into a cohesive model.
The final phases involve the actual dashboard implementation and executive training. We set up reporting automation to eliminate the manual labor costs that often drain team resources. This ensures that your leadership team always has access to real-time insights without the risk of human error. To ensure your organization is prepared for this transition, you can begin by reviewing our analytics readiness checklist to identify potential bottlenecks in your current data strategy. This methodical approach ensures your technical infrastructure is fully capable of supporting high-level decision-making.
Driving ROI: The Business Impact of Strategic Analytics Consulting
The final objective of any technical implementation is the realization of measurable business value. While the previous phases of our roadmap established the architecture and automation, the true impact lies in how these systems move the needle on organizational ROI. The return on investment for sophisticated data systems is not merely theoretical; for instance, CRM systems alone deliver an average return of $8.71 for every dollar spent when properly integrated. Professional executive dashboard development services ensure that this value is captured by transitioning your leadership team from reactive reporting to a proactive, data-driven strategy.
By eliminating information silos, a strategic dashboard fosters cross-departmental alignment. When the CMO, CFO, and COO all operate from a single source of truth, the friction of conflicting numbers disappears. This alignment transforms analytics from a departmental cost center into the intellectual engine of executive success. It allows leadership to identify underperforming assets or emerging market opportunities with surgical precision, ensuring that capital is deployed where it will generate the highest financial impact.
Transforming Uncertainty into Informed Action
There is a profound psychological relief that comes with having reliable data at your fingertips. In a complex business environment, organizational confusion is a significant drain on executive energy. Clear, automated reporting supports faster and more confident board-level decisions by replacing speculation with evidence. This is where the “Trusted Advisor” model becomes critical. Rather than just providing a tool, strategic analytics consulting provides a long-term roadmap for institutional health. It ensures that as your business evolves, your reporting framework remains a stabilizing force that justifies your strategic vision to stakeholders.
The Lina Lula Advantage
Our approach to executive dashboard development services is rooted in a strategy-first methodology. We recognize that for leadership teams, substance must always precede style. Our professional services are designed to eliminate the manual noise and spreadsheet fatigue that stifle innovation. We don’t just build dashboards; we create decision-support frameworks that align your technical data with your specific business outcomes. This pragmatic focus ensures that your investment in data results in streamlined efficiency and sustained growth.
The transition from fragmented complexity to strategic clarity is a choice. You can continue to manage through the fog of manual reporting, or you can establish a foundation of precision that enables your success. Align your data with your business outcomes today and turn your organizational data into your most powerful strategic asset.
Transitioning from Information Overload to Strategic Clarity
Effective leadership in a complex environment requires more than just access to data. It demands a structured framework that translates technical complexity into financial and operational precision. By establishing a single source of truth through professional executive dashboard development services, your organization moves from a state of fragmented uncertainty to one of streamlined efficiency. This transition ensures that every board-level decision is rooted in reliable, automated insights rather than manual, error-prone spreadsheets.
The path to organizational agility involves aligning your technical infrastructure with your long-term business outcomes. Our strategy-first implementation focuses on ROI, ensuring that your chosen platform serves as a stabilizing force for your vision. We specialize in eliminating reporting noise through expert GA4, GTM, and BI platform management, allowing your team to focus on high-stakes strategy rather than data reconciliation.
Request an Analytics Readiness Assessment from Lina Lula to identify the gaps in your current data architecture and begin your transition toward informed action. With the right architecture in place, your data becomes the intellectual engine that enables your sustained success.
Frequently Asked Questions
What are executive dashboard development services?
Executive dashboard development services are strategic consulting engagements that transform raw data into a decision-support framework. These services prioritize the alignment of technical metrics with board-level financial objectives. It isn’t just about visuals. By moving from fragmented reporting to a unified architecture, they enable leadership to identify risks and opportunities with precision. This process establishes a single source of truth that translates operational data into institutional health indicators.
How much do professional dashboard implementation services cost in 2026?
The cost of professional dashboard implementation is determined by the complexity of your data architecture and the number of integrations required. Factors such as the volume of heterogeneous data sources and the need for custom data modeling influence the final investment. Organizations should evaluate these requirements against the potential ROI, as well as the specialized skill sets needed to manage modern BI platforms and secure data governance protocols.
How long does it take to develop a custom executive reporting dashboard?
Development timelines vary based on the project’s scope and technical complexity. A relatively straightforward business platform typically requires 2 to 4 months for delivery. More complex implementations involving multiple integrations and advanced data modeling usually take between 5 and 8 months. Enterprise-level systems with extensive compliance requirements and real-time processing needs can extend to 12 or 18 months to ensure full operational reliability.
Can you integrate data from GA4, Salesforce, and finance software into one view?
Yes, consolidating GA4, CRM data like Salesforce, and financial software is a primary objective of executive dashboard development services. This integration eliminates information silos by merging digital marketing attribution with bottom-line sales performance. It ensures accuracy. By establishing a centralized data model, leadership gains a holistic view of the entire customer journey. This provides the necessary context to justify marketing spend and evaluate overall business impact.
What is the difference between a dashboard and a report?
A report is a static document that summarizes historical performance, while a dashboard is a dynamic tool for real-time decision support. Reports often focus on the “what” of past events, whereas dashboards highlight the “so what” by visualizing trends and anomalies as they occur. This interactivity allows executives to drill down into specific data points, moving from a high-level overview to granular insights within a single interface.
Why should we hire a consultant instead of using an in-house team?
Hiring a consultant provides access to specialized expertise and an objective perspective that in-house teams often lack. Strategists bring deep knowledge of GA4, GTM, and BI platforms, ensuring that implementation follows industry-standard best practices. This approach avoids the internal biases that can compromise data integrity. It also allows your internal staff to focus on core operations while experts build a scalable intellectual engine for your leadership.
How do you ensure data accuracy in automated reporting?
Data accuracy is ensured through rigorous data governance and precise tracking implementation at the source. We utilize GTM to verify that every digital interaction is captured correctly before it reaches your BI platform. By establishing automated workflows, we eliminate the manual spreadsheet errors that often undermine executive trust. Regular audits and a centralized data model further guarantee that all stakeholders are viewing consistent, verified numbers.
What is an Analytics Readiness Assessment?
An Analytics Readiness Assessment is a diagnostic phase that evaluates your current data infrastructure before implementation begins. It involves reviewing your GTM and GA4 setups to identify gaps or measurement inaccuracies that could compromise reporting. This assessment ensures you don’t build on a foundation of “dirty” data. It’s an essential first step in creating a reliable Analytics Readiness Checklist that guides the development of a strategic, ROI-focused executive dashboard development services framework.